Case study 03 / 17Next.js Front-End
GPU-aware orchestration of live 3D maps in an operations dashboard
A frame manager that keeps one live WebGL map per row, verifies every frame by pixel readback and falls back to local terrain offline.
Stack
- React
- Next.js
- TypeScript
- CesiumJS
- WebGL
- ECharts
- Headless Chrome
01 · How it works
- TodaytoChanged in this work
- Data flow
What it does
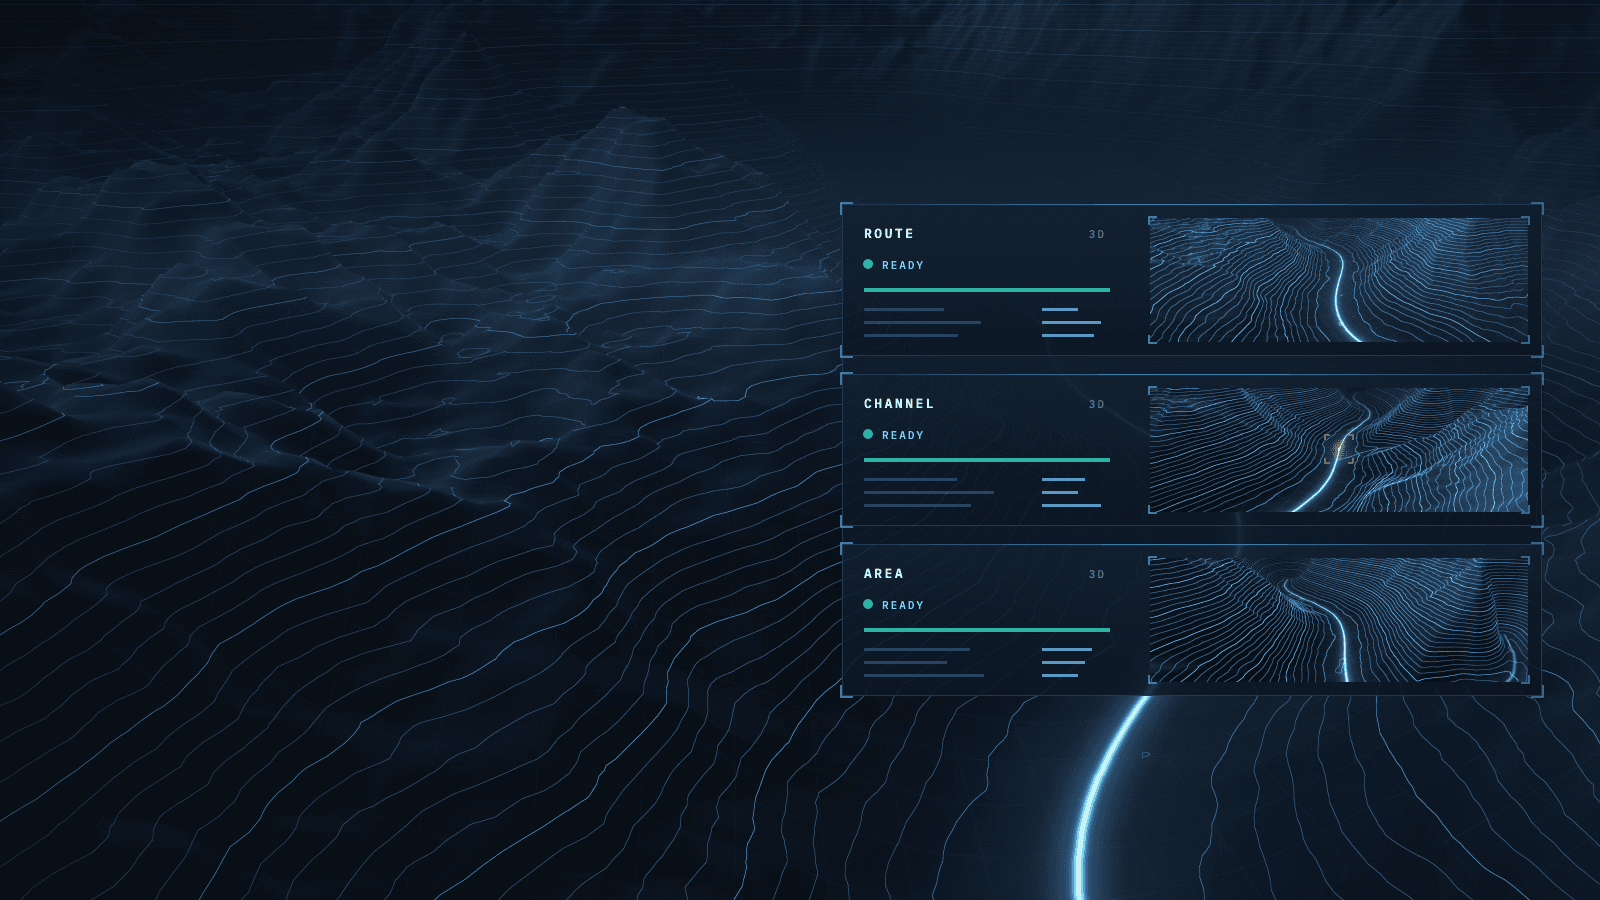
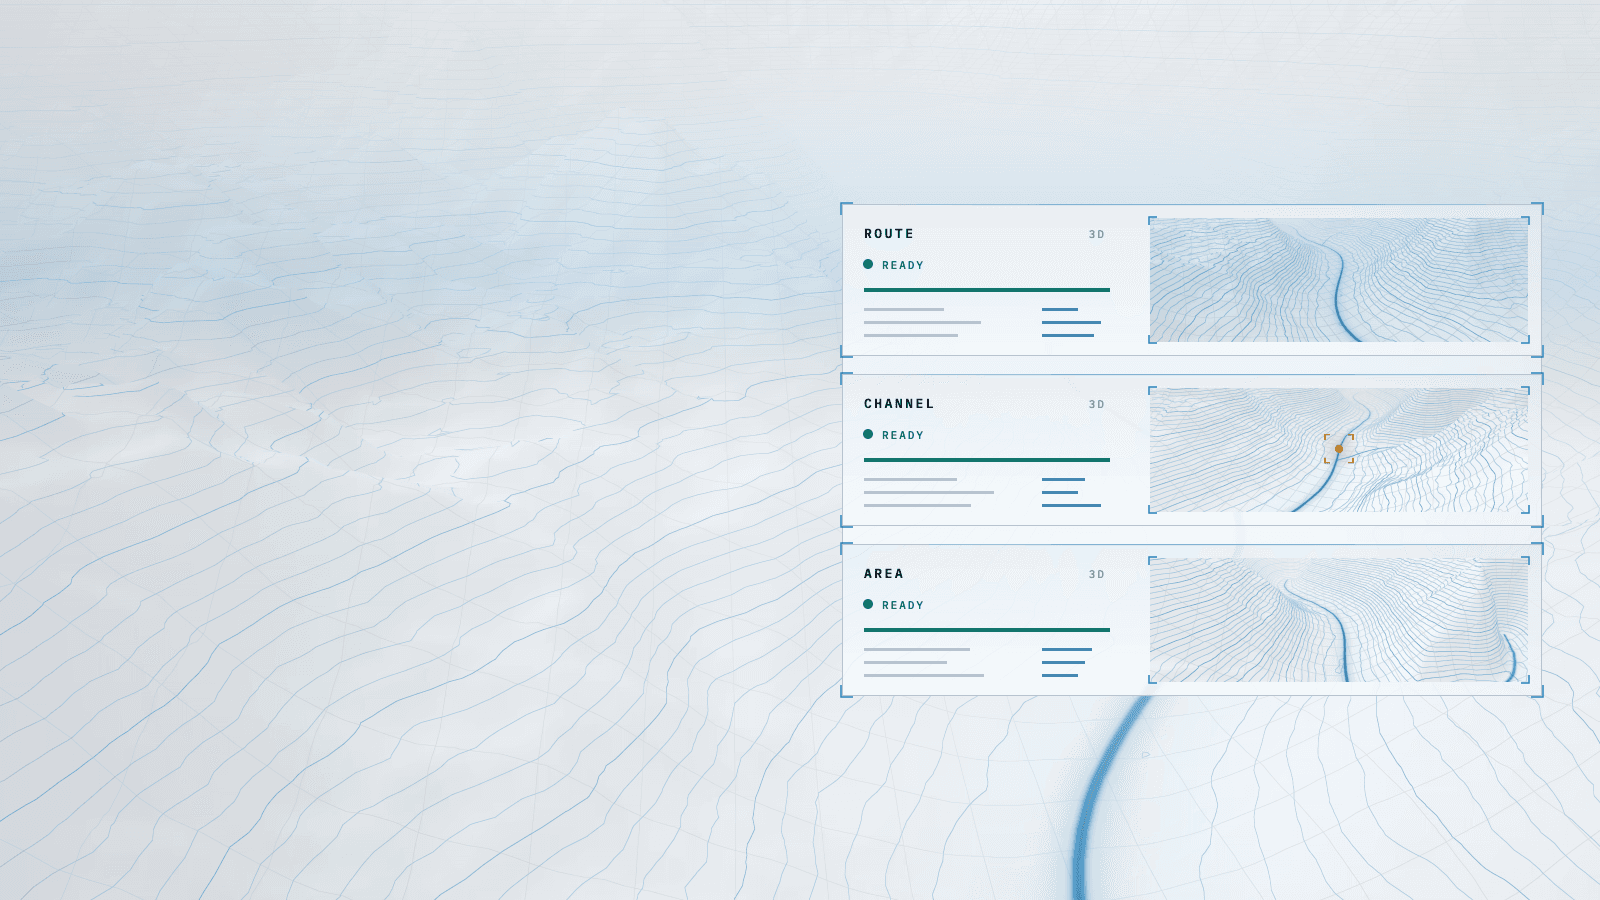
Every row of the monitoring platform's dashboard embeds a live 3D map with an elevation profile, which operators use to locate alarms and leaks along a line. I designed the frame manager that governs those maps: how many stay live, where each is placed, when it is parked or restored, and how each rendered frame is verified before an operator sees it.
Read more
Correctness came first, then speed, with every failure mode counted on the platform's health page.
6 connections· select a part to trace it
- Dashboard row to Map frame manager: slot position, 2× a second
- Map frame manager to 3D map frame: places, shows or parks it
- 3D map frame to GPU canvas: draws a full frame
- GPU canvas to Identity-mark check: hidden mark read back
- Identity-mark check to Map frame manager: wrong image: cover, rebuild
- Map frame manager to Health page: counts each case per hour
02Results
- R01Lower is better
Dashboard maps rebuilt after an 11-minute absence
Before 75%, after 0%, eliminated. Lower is better.BeforeAfter - R02Lower is better
Active 3D maps per dashboard row
Before 2, after 1, 2× lower. Lower is better.BeforeAfter - R03Lower is better
Blank-map time on a view switch
Before 6.4 s, after 0 s, eliminated. Lower is better.BeforeAfter
What it achieved
- Map integrity: cross-rendered frames possible on integrated graphics → one live WebGL context per row by design, 0 faults in 600+ verified frames
- Returning to the dashboard: 75% of maps rebuilt → 0%, parked maps restored in place
Read more
- View switch: 6.4 s of blank map → no blank frame
- Terrain service outage: no map after 30 s → local terrain in about 4 s
- Dark-theme legibility of the profile scale and legend: 2.6:1 contrast → 10.9:1
The challenge
Operators reported a dashboard row showing another system's map. Data, identity and placement were all correct; the fault sat below the application. On machines with integrated graphics, a row could hold up to three live WebGL contexts competing for shared GPU memory, and their output blended in one canvas. No code path was wrong, so no code-path fix could be trusted: the architecture had to make the fault impossible by design and detectable if it ever recurs.
Read more
The same design had to absorb the platform's everyday failure modes: a blank map for 6.4 s on every view switch, most maps rebuilt from scratch after a short absence, and no map at all when the online terrain service stopped responding.
What I learned
Measure what reaches the screen, not what the code reports: the frame manager once logged 98 ms for a switch that took 15.5 s to appear. Once GPU memory proved to be the governing constraint, one live context per row became an invariant, and I gave up preloading even though it made first switches faster.
Read more
A slower cold switch is an acceptable price for a map that is always the right one. Knowing what not to build mattered as much: tile pre-warming was dropped because time to first byte was already low.
Stack
- React
- Next.js
- TypeScript
- CesiumJS
- WebGL
- ECharts
- Headless Chrome
Skills
- 3D rendering on the web
- GPU resource management
- Reliability engineering
- Root-cause analysis
- Accessible data visualization