Case study 01 / 21JS Front-End
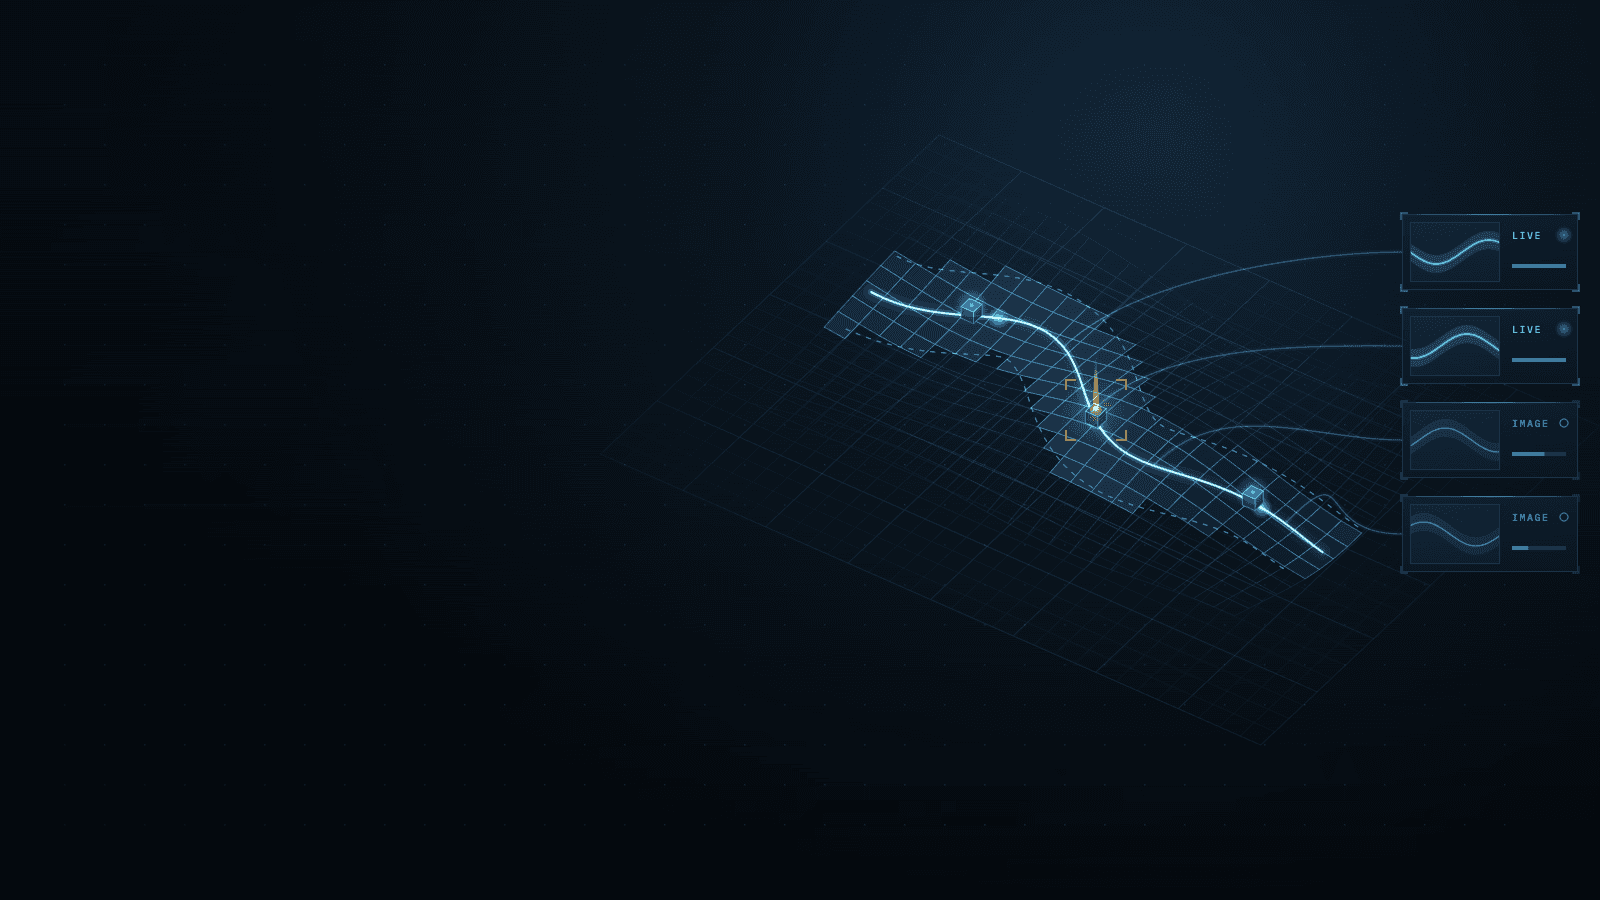
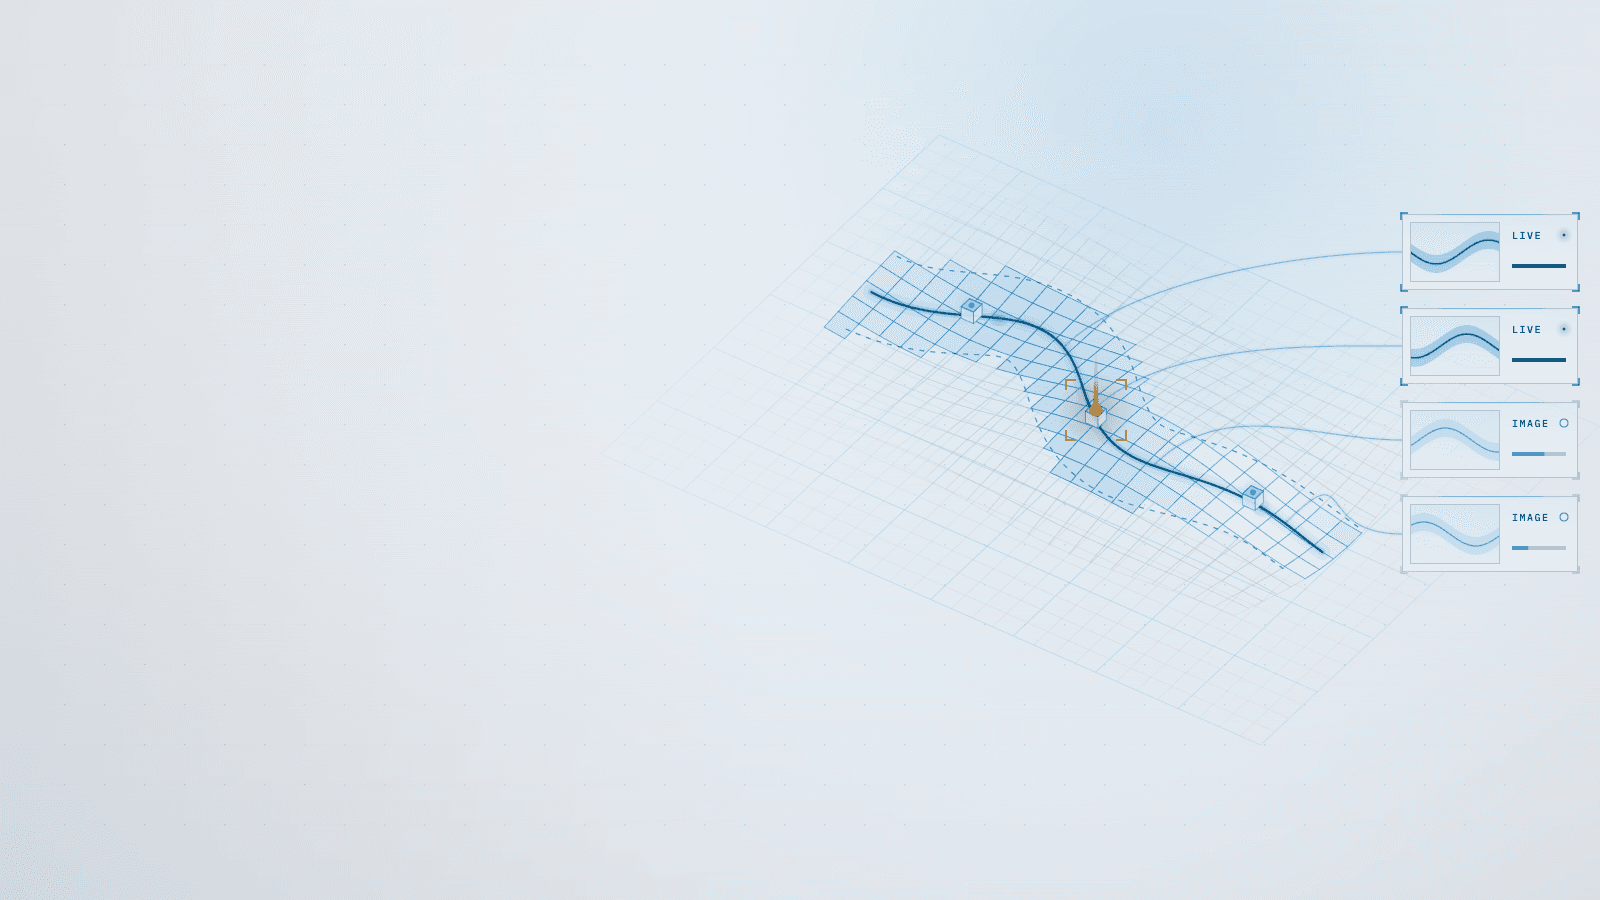
Per-client offline 3D maps trimmed to each pipeline's corridor
Each client's build ships only its own 3D maps, trimmed to the corridor along each line: from 17.1 GB to 45 MB for a two-system client.
Stack
- CesiumJS
- WebGL
- Leaflet
- nginx
- Node.js
- Next.js
- TypeScript
- WebP
01 · How it works
- TodaytoChanged in this work
- Data flow
What it does
The live 3D pipeline maps that operators use to follow alarms and leaks run offline at client sites, on modest PCs with about 8 GB of RAM and only a browser. I reworked how those maps are packaged and started: each client's build carries only its own systems, trimmed to the corridor along each line; every dashboard row shows its map as an image before the 3D is ready; and a system whose map was only a drawing got the same live functions as the others.
6 connections· select a part to trace it
- Client profile to Per-client build: lists its systems
- Per-client build to Offline client package: own maps, corridor terrain
- Offline client package to Dashboard row: start image at oncechanged
- Offline client package to 3D map engine: terrain and ground tiles
- 3D map engine to Dashboard row: live 3D fades in
- Dashboard row to Operator: image, then live map
02Results
- R01Lower is better
Map data shipped to a client with two systems
Before 17,132 MB, after 45 MB, 381× lower. Lower is better.BeforeAfter - R02Lower is better
Dashboard, first visit: a map image in every row
Before 9.3 s, after 2.5 s, 3.7× lower. Lower is better.BeforeAfter - R03Higher is better
Live functions on the map that was only a drawing (of 8)
Before 0, after 8, from zero. Higher is better.BeforeAfter
What it achieved
- Map data for a client with two systems: 17.1 GB, every map for every client → 45 MB: its own maps and ground style, terrain trimmed to its corridors
- Clients without maps: 17.1 GB of tiles → none; the app shows the chart alone and the health page reports gray, never red
- The map that was only a drawing: 0 of 8 live functions → 8 of 8, mostly through data and configuration, with no system name in the code
Read more
- Ground styles: photo and street maps → two more, contours and relief, in light and dark on every map, with 0 changes to anything drawn on top
- Dashboard on a first visit: the fourth map on screen at 9.3 s → a start image in every row at 2.5 s, rendered at build time, with the live 3D fading in over it
- 2D dashboard rows, A/B-tested and parked on a separate branch (3D stays the default): 2.3–2.7 s waiting for GPU shaders → 0, the last row live 86–93% sooner, 94% fewer map requests
The challenge
Every installation received all 19 map tile sets, 17.1 GB, even when its systems sat in one region, and 40% of that covered regions with no system at all. Inside each map's folder, a copy of the whole world's base terrain outweighed the map's own terrain. Whatever its ground style, one offline map took 1.3–1.9 GB of browser RAM, nearly half of it GPU memory.
Read more
On the dashboard the maps started one after another: on a first visit the fourth appeared after 9.3 s, with the main thread busy for 8.3 s of it, 2.4 s of which went to waiting for the GPU to compile shader programs. And one system's map was only a drawing in a fixed color, with none of the 8 live functions the other maps had, although the backend already polled its data.
What I learned
The weight was not where it looked. The engine, not the imagery, set each map's memory: a light mode that cut one map's RAM by 24–36% was lost in noise with four maps on the dashboard. Nor was the network the bottleneck: nginx in front and a startup bundle per map cut requests by 20% and dashboard time by 12%, but the main thread stayed busy.
Read more
So I dropped one 3D engine for all four maps, as starting their frames cost only 0.45 s, and a custom engine build worth under 0.1 s per map. A hash check also missed 88 banner tiles on screen, each with a different slice of a watermark; brightness now finds them.
Stack
- CesiumJS
- WebGL
- Leaflet
- nginx
- Node.js
- Next.js
- TypeScript
- WebP
Skills
- Offline map packaging
- 3D rendering on the web
- Performance profiling
- A/B measurement
- Build tooling