Case study 01 / 17Data Science
A verifiable 3D spill-simulation twin for pipelines and channels
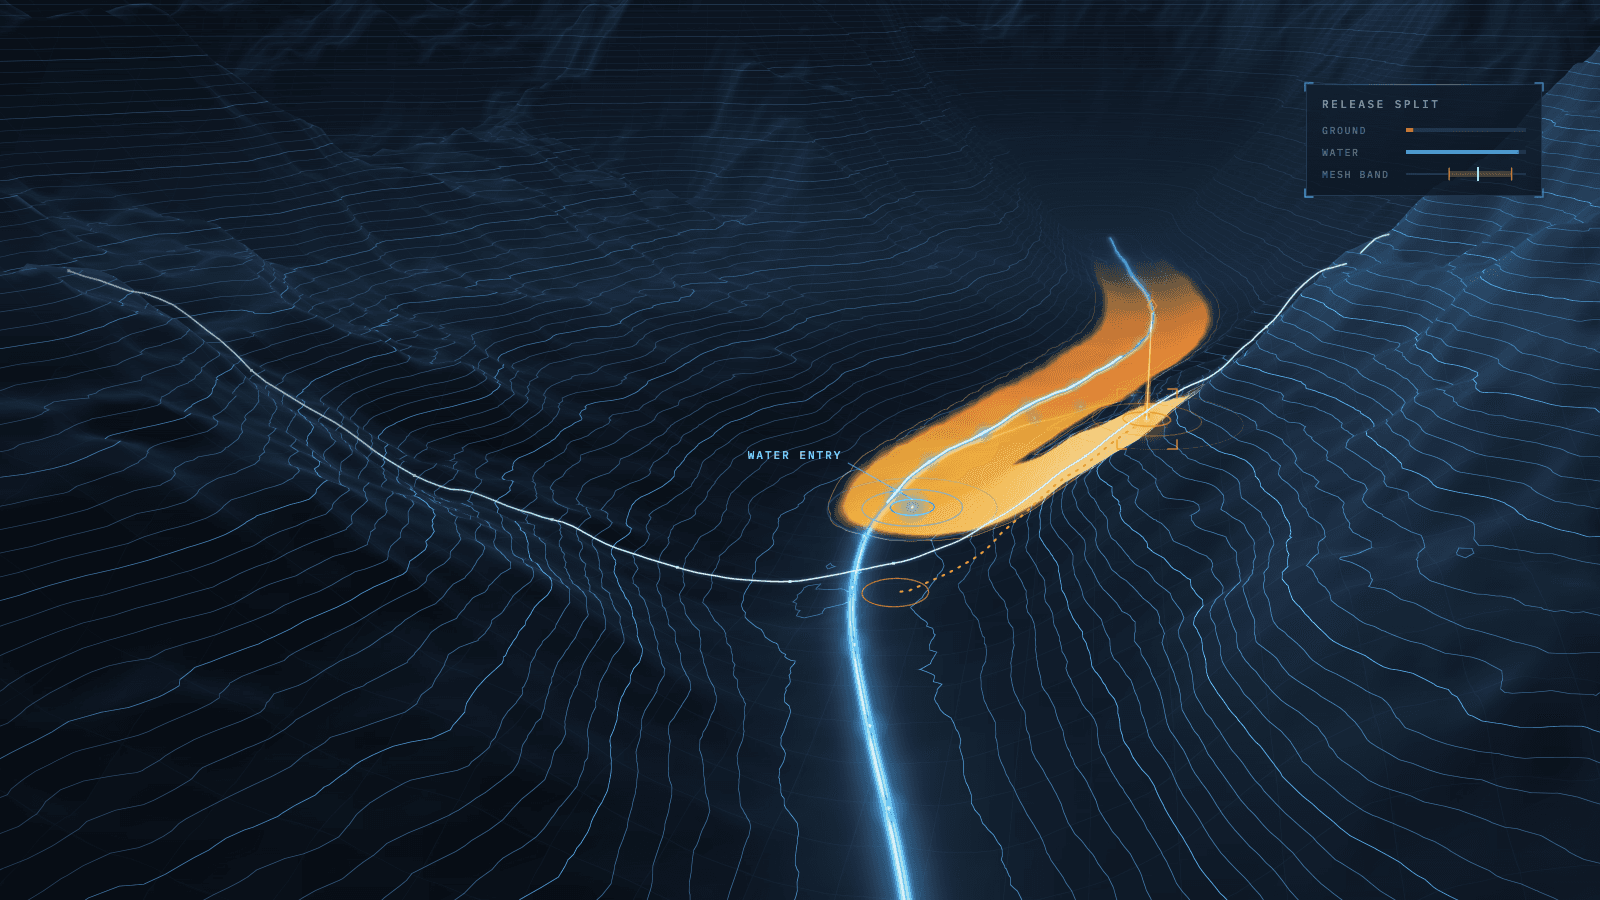
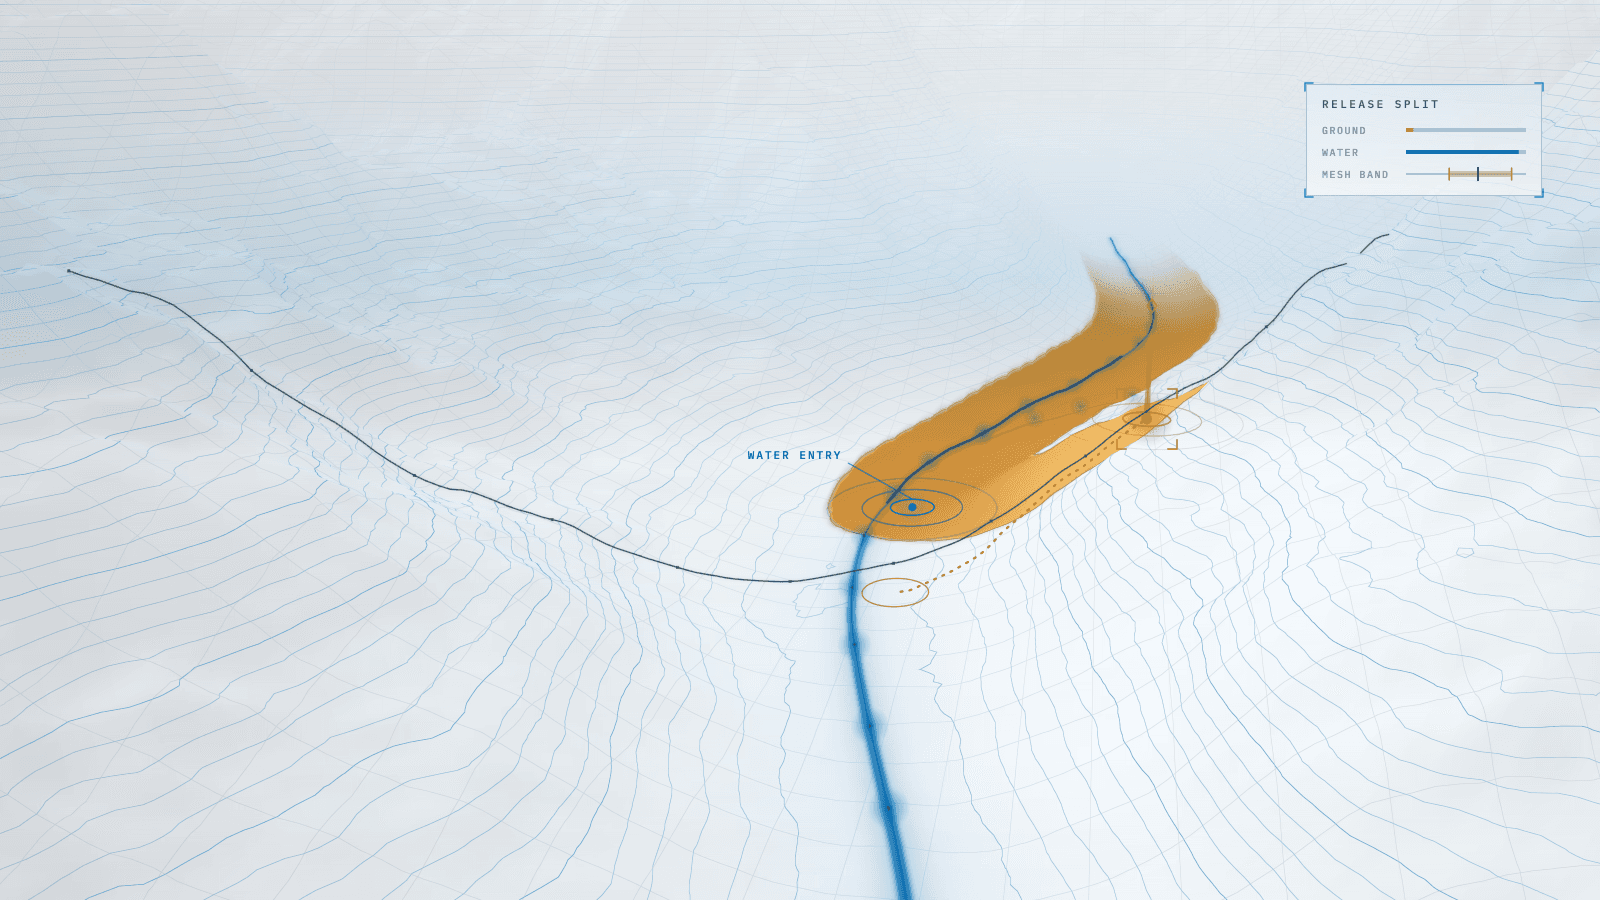
A browser twin that shows where a release travels over real terrain, how much reaches water and how certain each result is.
Stack
- JavaScript
- Node.js
- CesiumJS
- WebGL
- Copernicus DEM
- OpenStreetMap
- Chrome DevTools Protocol
- Azure App Service
01 · How it works
- TodaytoChanged in this work
- Data flow
What it does
A browser-based 3D digital twin of a pipeline system and a channel that carry a dense, solids-laden fluid. It answers the operational question behind any release: where the fluid travels over real terrain, how far and how deep it settles, how much stays on the ground, how much reaches water, and when.
Read more
As its engineer, I extended the physics to account for water entry and deposit shape, made numerical uncertainty visible, and built the instruments that verify the engine.
7 connections· select a part to trace it
- Leak or overflow to Runout engine: release rate and volume
- Terrain + water map to Runout engine: slope per cell, water
- Runout engine to Ground / water split: ground until it meets water
- Runout engine to Mesh + yield bands: reruns at ½× and 2× step
- Runout engine to Verification checks: 20 formulas, cell by cell
- Ground / water split to 3D map: deposit + river reached
- Mesh + yield bands to 3D map: range beside the value
02Results
- R01Higher is better
Hillside reaches with the ground/water split shown (of 34)
Before 0, after 29, from zero. Higher is better.BeforeAfter - R02Higher is better
Mesh-sensitive cases flagged on screen (of 21)
Before 0, after 21, from zero. Higher is better.BeforeAfter - R03Lower is better
Deposits stretched to the width cap (of 34 reaches)
Before 9, after 0, eliminated. Lower is better.BeforeAfter
What it achieved
- Water accounting: releases reaching water drawn and counted on 0 of 34 hillside reaches → 29 of 34, with the ground/water split and the river followed downstream
- Deposit shape on open slopes: 9 of 34 reaches stretched to the width cap → 0, through a fan rule measured outside the engine before it was built
- Numerical uncertainty: mesh-sensitive results flagged on 0 of 21 cases → 21 of 21, shown as a band beside the yield-stress band
Read more
- Verification: a one-off script → 20 hand-derived formulas, cell-by-cell checks and repeatability fingerprints; a +2% mutant engine fails 3 of 20
- Leak-level view: none → a camera standing on the drawn ground at the leak, looking down the path, on both pages
- Instrumentation: 2 of 8 pages with a ready mark and 6 of 95 controls tracked → 8 of 8 and 95 of 95, with zero new dependencies
The challenge
A what-if tool earns trust only if its numbers hold up, and three measurements showed where they did not. On hillsides a release appeared to stop growing after one to three hours; in fact the fluid was reaching water, and the page neither drew nor counted it. In the default hillside case 95% of the release entered a river unreported, and 25 of the 34 reaches that meet water sent more than half to it.
Read more
On open slopes the deposit was drawn as a sheet a few millimetres thick, stretched to the engine's width cap because nothing bounded the downhill side. And on a 30 m elevation model, 21 of 56 cases changed runout or area by more than 10% when the marching step was halved or doubled: the grid, not the physics, could decide where a spill went.
What I learned
Verification is not validation. Matching the arrest formula cell by cell proves the engine computes what it claims; it says nothing about whether the assumed yield stress fits the fluid, so that value stays badged and banded. I showed numerical uncertainty instead of hiding it: the displayed result stays on the default mesh, and the band says how far the grid could move it.
Read more
An earlier claim that the pipe cases converged came from three cases; measured on nineteen, six did not, and I corrected the record. I also refused to count noise as progress: load-time drops during the work were logged as machine variance, not wins.
Stack
- JavaScript
- Node.js
- CesiumJS
- WebGL
- Copernicus DEM
- OpenStreetMap
- Chrome DevTools Protocol
- Azure App Service
Skills
- Physics-based simulation
- Geospatial modeling
- Numerical verification
- Uncertainty quantification
- Performance instrumentation