Case study 06 / 17Next.js Front-End
Full-stack performance engineering for a real-time monitoring platform
Audited the web client, API and 3D map service end to end: 31 measured findings, 25 shipped, 6 rejected on evidence, 10× replay on time.
Stack
- React
- Next.js
- MUI
- ECharts
- CesiumJS
- Service Workers
- Node.js
- InfluxDB
01 · How it works
- TodaytoChanged in this work
- Data flow
What it does
The monitoring platform combines a web client, an API and a 3D map service: users follow live profiles on a dashboard and replay history as a time-lapse. I ran an end-to-end performance audit across all three layers and kept a log of 31 measured findings.
Read more
25 shipped, 6 were rejected on evidence, and the platform now does work only when the data changes.
4 connections· select a part to trace it
- API (history) to Frame builder: returns history in batches
- Playback clock to Frame builder: fires each frame on its slot
- Frame builder to Profile charts: reused objects, one update
- Frame builder to Light per-frame tables: rows for the current frame
02Results
- R01Higher is better
Frames on time at 10× playback
Before 0%, after 99%, from zero. Higher is better.BeforeAfter - R02Lower is better
Main-view re-renders at rest, per 20 s
Before 76, after 2, 38× lower. Lower is better.BeforeAfter - R03Lower is better
JavaScript on the heaviest page
Before 2,512 KB, after 1,762 KB, −30%. Lower is better.BeforeAfter
What it achieved
- Time-lapse replay at 10×: no frame on time → 98–99% on time
- Idle cost: continuous map repaints and re-renders → maps idle, 2 re-renders per 20 s
- Database load: ~305 → ~10 background reads per minute
Read more
- Engineering backlog: unmeasured opinions → 31 measured findings, 25 shipped, 6 rejected on evidence
- JavaScript on the heaviest page: 2.51 MB → 1.76 MB (−30%)
The challenge
The platform consumed resources when nothing was happening. At rest the main view re-rendered 76 times in 20 seconds, the 3D maps repainted continuously, and a map parked off-screen kept drawing and fetching. Underneath, a poller queried the database about 305 times a minute.
Read more
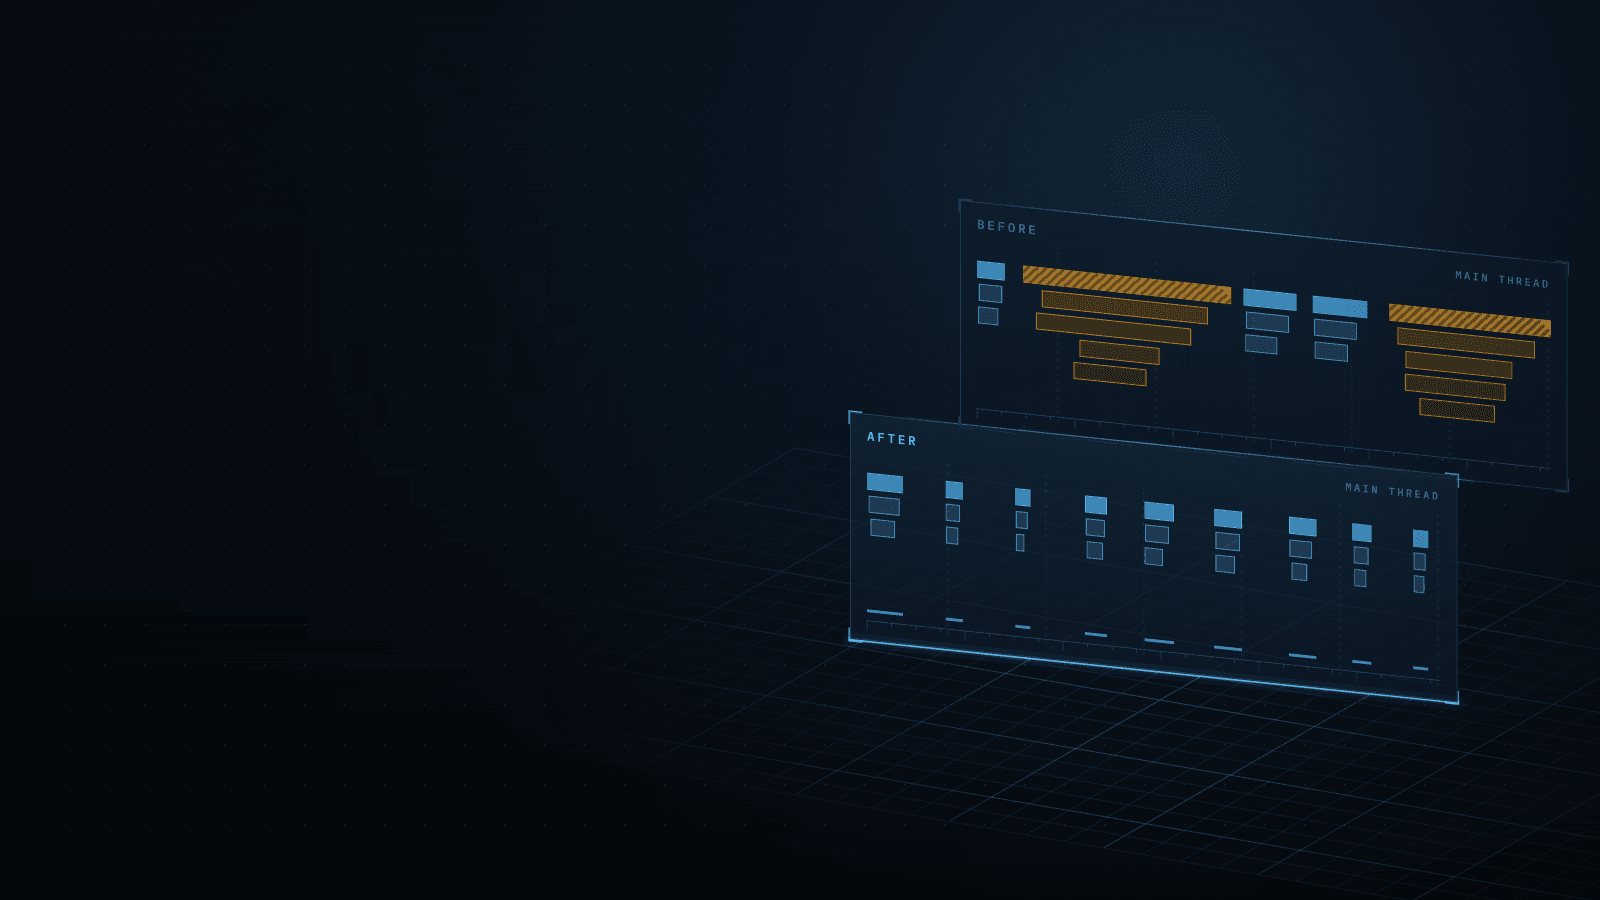
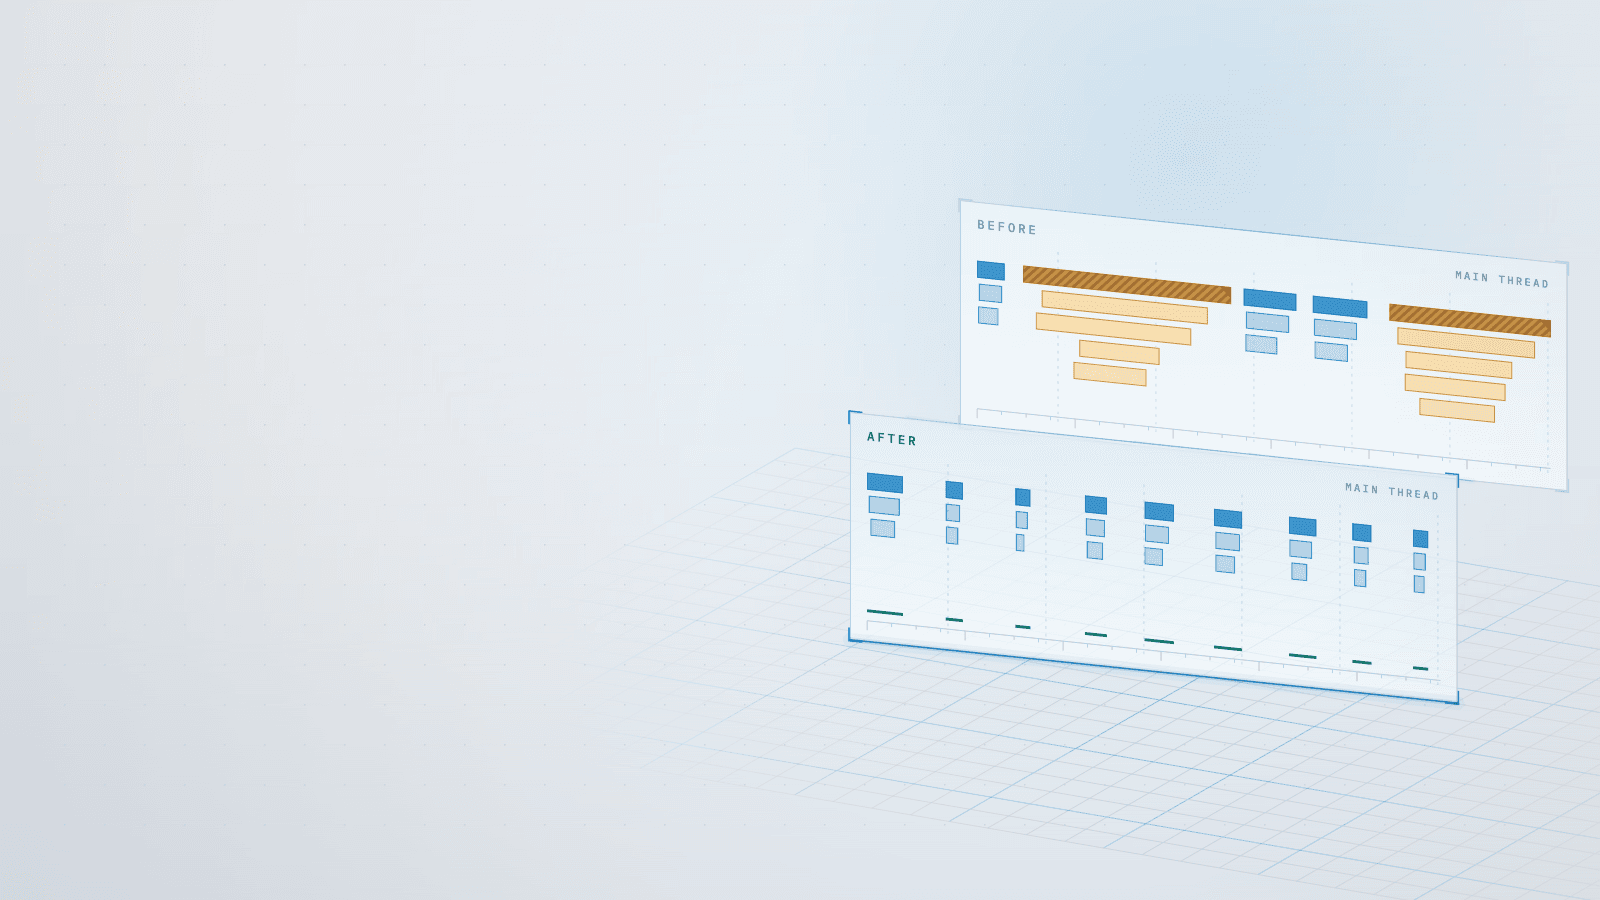
The time-lapse replay exposed the full cost: at 10× speed not a single frame met its deadline, because every step handed the charts new objects and they redrew from scratch. The task was to find the waste across three layers, prove each cause with a measurement, and remove it without changing anything users see.
What I learned
Measurement rewrote the plan. Sending only new data to the charts looked like the obvious fix; measured, an update cost the same regardless of payload, and the real cost was a highlight reapplied after every point. Merging three chart libraries, removing glow series and rebuilding annotations less often were all dropped on evidence.
Read more
When the test machine itself drifted 2.4× between runs, I compared operation counts instead of milliseconds. A performance audit is judged by the changes it rejects as much as by the ones it ships.
Stack
- React
- Next.js
- MUI
- ECharts
- CesiumJS
- Service Workers
- Node.js
- InfluxDB
Skills
- Performance engineering
- Full-stack profiling
- Front-end architecture
- Data visualization
- Technical audits