ProjectReact Front-End
Live production view with completion-time forecasts
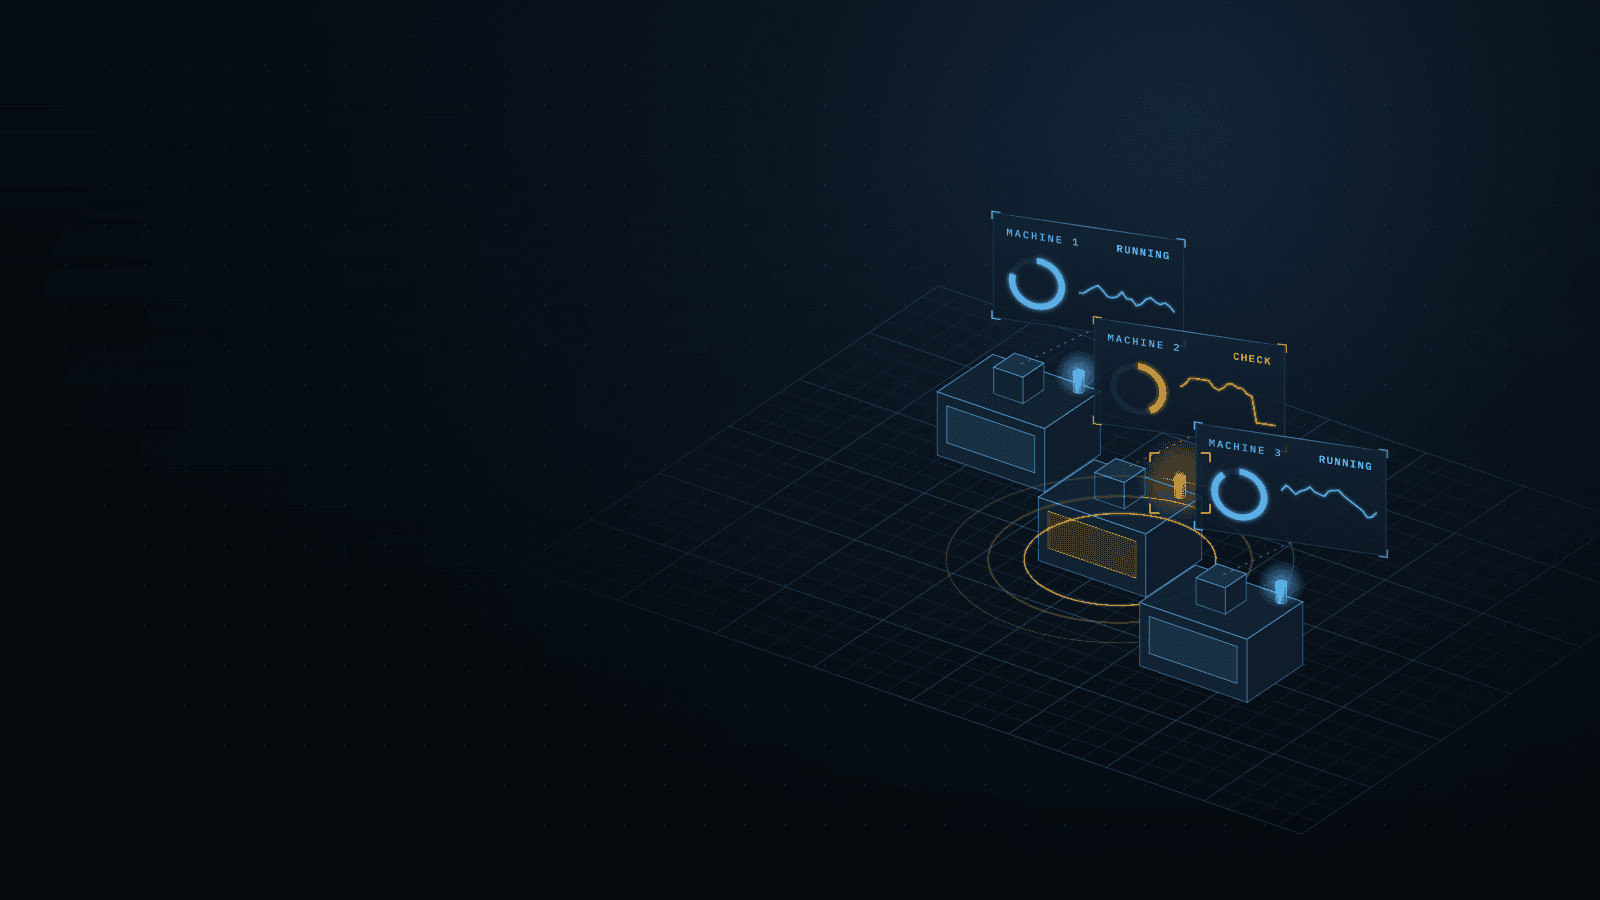
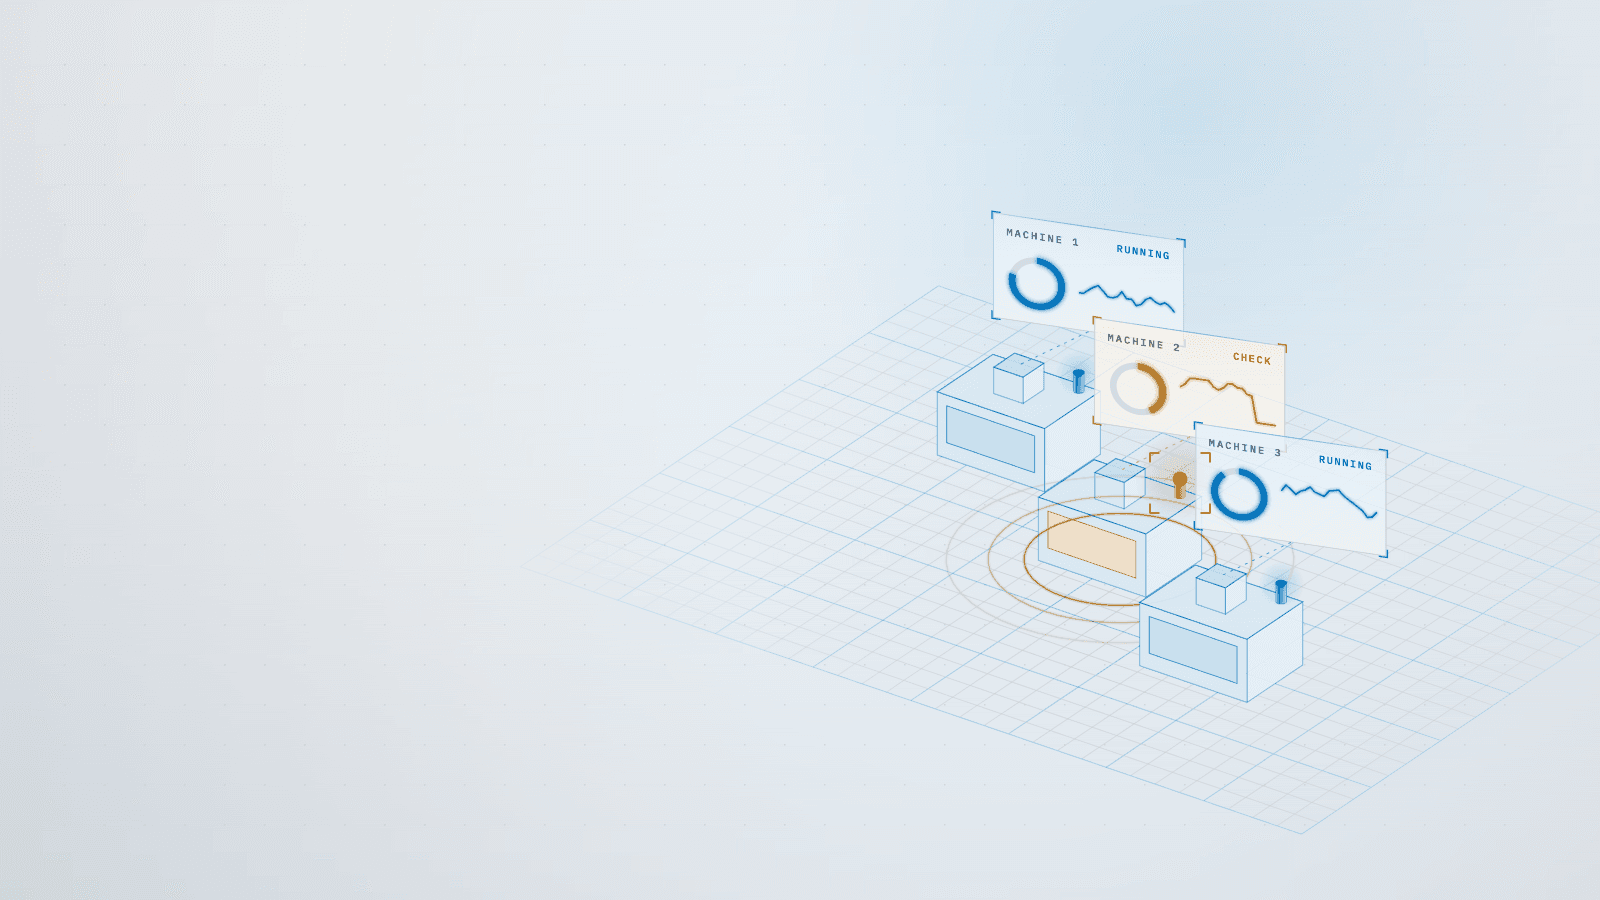
A live view of three critical machines with per-machine drill-downs, completion-time forecasts and alerts that protect delivery dates.
Stack
- React.js
- Streamlit
- Support Vector Machine (SVM)
- Python
- Pandas
- DynamoDB
- Kinesis
- SQS
- +8
01 · How it works
- TodaytoChanged in this work
- Data flow
What it does
A live production view of three critical machines, a laser, a CNC machine and a welding robot, showing units produced, cycle time, downtime and energy as they happen. From the overview, each machine opens its own detailed dashboard, and a model trained on history forecasts when each project will finish.
Read more
I built the streaming pipeline, the dashboards, the forecasting model and the alerts that email the right people when a forecast slips or downtime grows.
7 connections· select a part to trace it
- Production machines to Data stream + queue: units, cycle time, downtime
- Data stream + queue to NoSQL store: processed readings
- NoSQL store to Live dashboard: real-time metrics
- Live dashboard to Machine micro-dashboards: per-machine drill-down
- NoSQL store to SVM completion model: historical projects
- SVM completion model to Live dashboard: predicted completion
- SVM completion model to Email alerts: predicted time exceeded
02What it achieved
Outcome
- Visibility: live production metrics for three critical machines, with a drill-down per machine
- Delivery: completion-time forecasts per project from a model trained on history
Read more
- Response: email alerts when a project runs past its forecast or downtime grows
- Analysis: filters by machine, date range and project type for focused review
The challenge
Real-time monitoring is a data-flow problem first: readings from several machines had to stream through a queue, be processed and stored, and reach the dashboard without gaps. The overview and the detailed machine views were built with different tools, so they had to share data and context cleanly.
Read more
The forecast was the harder part. Predicting completion time needed careful data cleaning, feature engineering and tuning before its estimates were good enough to drive alerts that people would act on. Filters by machine, date range and project type had to keep the views focused without hiding the overall picture.
What I learned
Live dashboards are only as good as the pipeline under them; the streaming and storage design decided what the screens could show. Combining a fast overview with deep per-machine views worked because each tool did what it does best.
Read more
A forecast becomes valuable when it changes behaviour: tying predictions to alerts turned a model into an early warning for late deliveries.
Stack
- React.js
- Streamlit
- Support Vector Machine (SVM)
- Python
- Pandas
- DynamoDB
- Kinesis
- SQS
- Lambda
- SageMaker
- CloudWatch
- AWS S3
- API Gateway
- AWS CodeCommit
- AWS Amplify
- AWS Cognito
Skills
- Real-time data pipelines
- Operational dashboards
- Predictive modelling
- Alerting design
- Cloud architecture