Case study 17 / 17JS Front-End
A heat map that shows where manufacturing is delayed
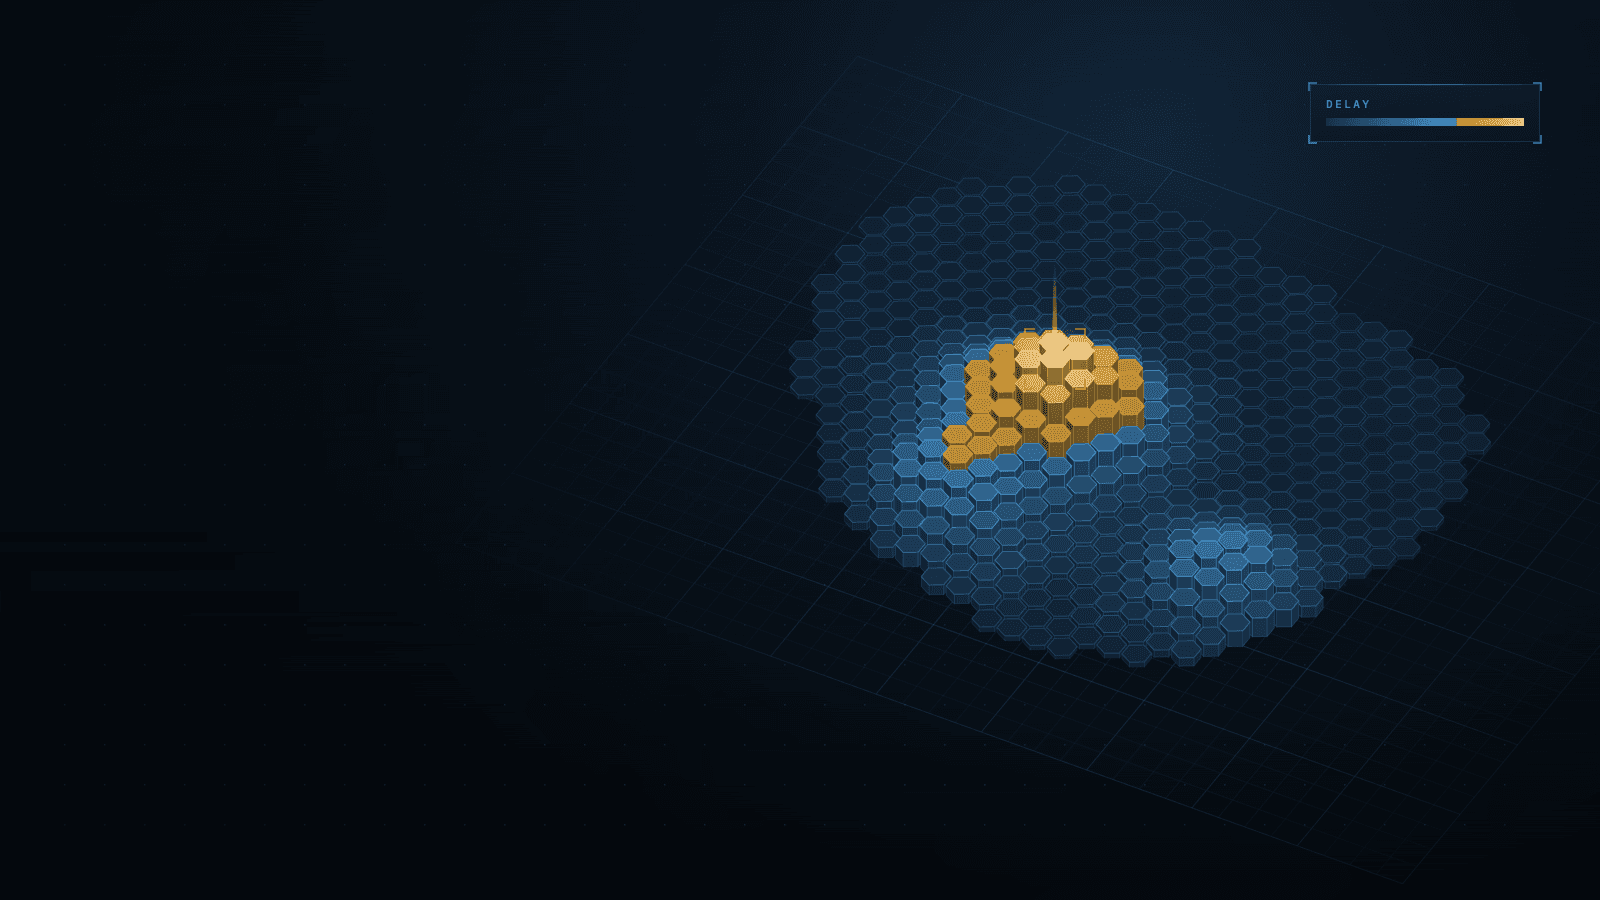
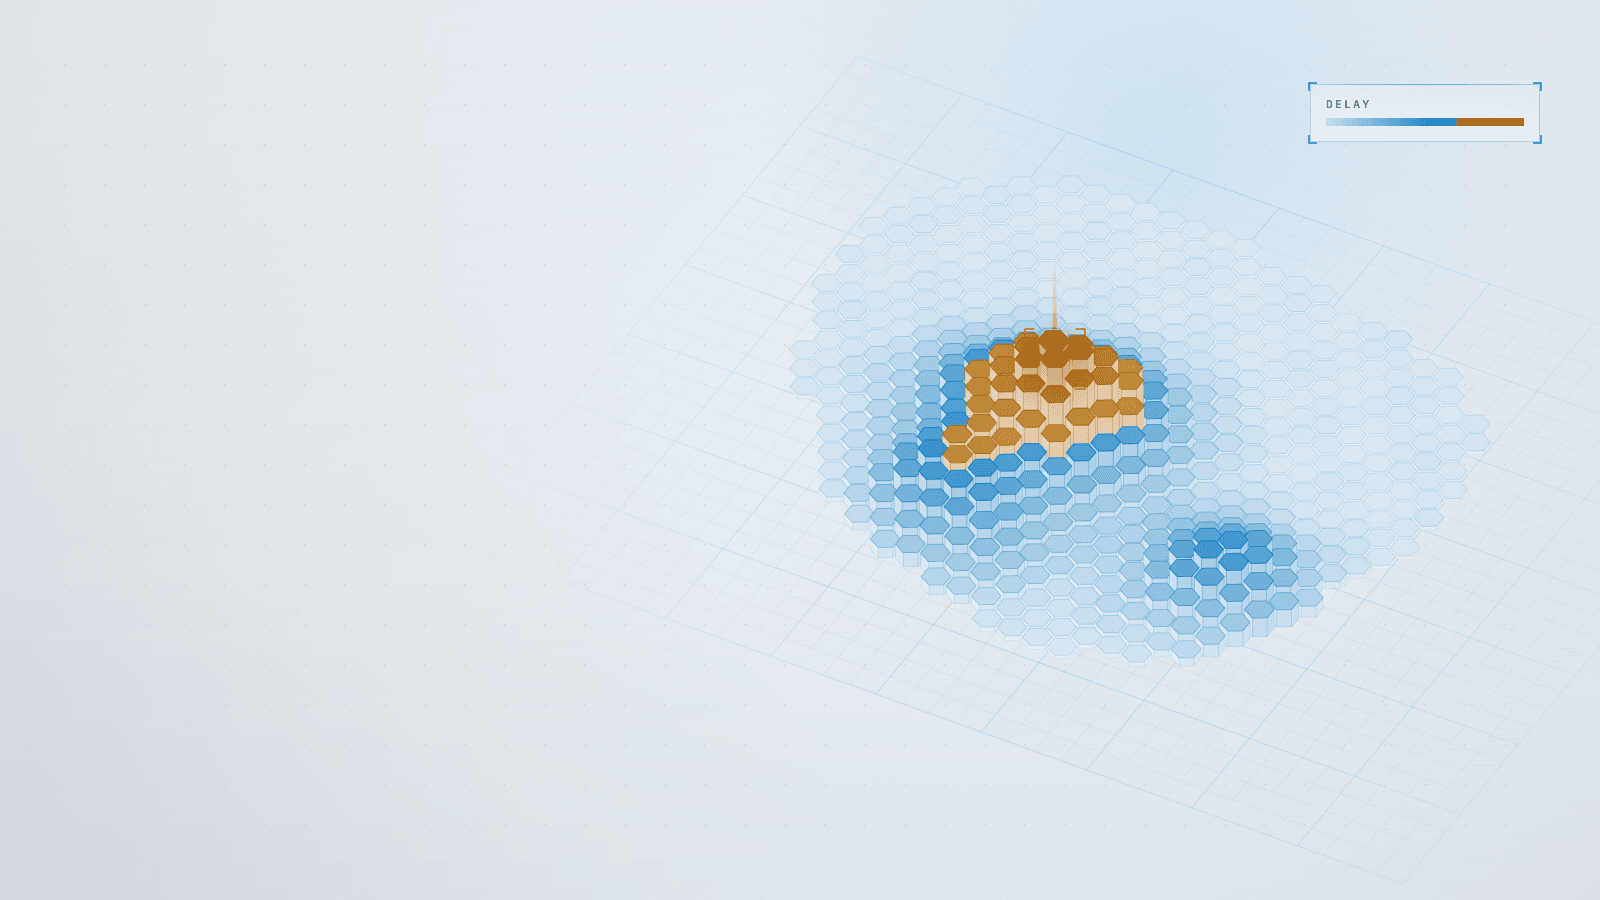
An interactive heat map of manufacturing delays by region and order status, so operations can see bottlenecks and act 40% sooner.
Stack
- HTML5
- CSS3
- JavaScript
- deck.gl
- Python
- Pandas
- JSON
- Excel
- +2
01 · How it works
- TodaytoChanged in this work
- Data flow
What it does
An interactive map that shows where manufacturing orders are delayed, by region and order status, so the operations team can spot bottlenecks at a glance instead of reading spreadsheets. A Python pipeline cleans the source workbooks into compact data files, and a WebGL heat map layer draws them in the browser from static hosting.
Read more
I built it end to end, from data cleaning to the visualisation and the deployment.
5 connections· select a part to trace it
- Spreadsheet sources to Cleaning script: raw orders and delays
- Cleaning script to JSON data files: normalized regional data
- JSON data files to Static hosting + CDN: published data
- Static hosting + CDN to Heat map layer: page and data files
- Heat map layer to Operations team: delay hotspots by regionchanged
02Results
- R01Lower is better
Time to identify and address delays (100% = before)
Before 100%, after 60%, −40%. Lower is better.BeforeAfter
What it achieved
- Response to delays: time to identify and address them cut by 40 %
- Visibility: delays by region and order status on one interactive map
Read more
- Data quality: messy spreadsheets turned into clean, consistent data files on every refresh
- Operations: static hosting with a CDN, nothing to run or patch
The challenge
The source data lived in spreadsheets with inconsistent formats, missing values and encoding problems, so every refresh risked a wrong picture. The cleaning pipeline had to make the data consistent before anything reached the map.
Putting it on a map meant reconciling locations with regional boundaries, so that a delay lands in the right place and a colour means what it says.
Read more
The first versions were also slow to load and interact with as the data grew, which defeats a tool meant for quick decisions. And the design had to stay simple to operate: no servers to maintain, just a cleaning step and static hosting behind a CDN.
What I learned
A visualisation is only as credible as the data cleaning behind it, so the pipeline deserved as much care as the map. Geography adds its own traps: coordinates and regional boundaries have to be reconciled before a colour means anything.
Read more
For interactive maps, load and interaction speed are part of the product, not a polish step. And static hosting was the right weight for the job: cheap, fast and with nothing to maintain.
Stack
- HTML5
- CSS3
- JavaScript
- deck.gl
- Python
- Pandas
- JSON
- Excel
- AWS S3
- CloudFront
Skills
- Geospatial visualization
- Data cleaning pipelines
- Front-end development
- Static cloud hosting
- Operational dashboards